
En el corazón de la Ciudad de México, donde los destinos de naciones se entrelazan como hilos de un tapiz infinito, el Consejo Coordinador Empresarial (CCE) decidió dar un paso audaz. Este miércoles, bajo la sombra de tensiones comerciales que amenazan con fracturar la economía, el organismo empresarial selló un pacto con la Presidenta Claudia Sheinbaum. El enemigo común: los temibles aranceles del 25% impuestos por Estados Unidos a los productos mexicanos.
Tras una reunión que duró más de dos horas, un tiempo que pareció una eternidad, los representantes del sector privado extendieron su mano de apoyo a la Mandataria. “Lo que estamos haciendo ahora es un frente común con la Presidenta”, declaró con voz firme Francisco Cervantes, presidente del CCE. “La apoyamos para que esta negociación avance. Ha mantenido una comunicación directa y efectiva con el Presidente Trump, y mañana tendrán otra llamada”.
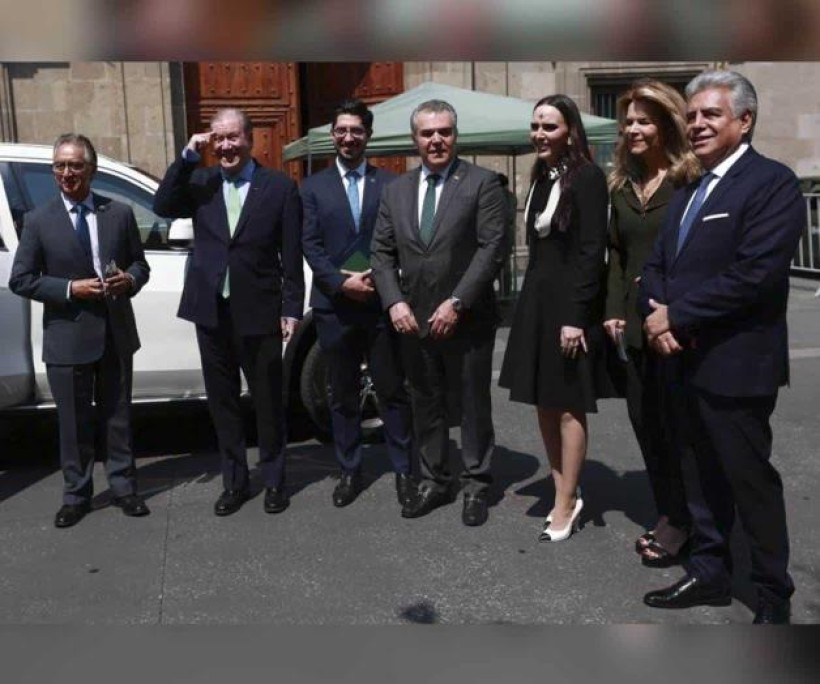
Al salir de Palacio Nacional, Cervantes no pudo ocultar la preocupación que flota en el aire como una nube oscura. “Las economías de ambos países están profundamente integradas”, afirmó, con un tono que resonó como un eco de advertencia. “Esta preocupación no solo es nuestra; también las grandes empresas estadounidenses, especialmente en el sector automotriz, están en alerta. En 37 sectores, estamos entrelazados”.
¿Habrá confianza en que la economía no se verá afectada? La pregunta quedó suspendida en el aire. “Hay preocupación”, admitió Cervantes, “pero en lugar de preocupados, estamos ocupados”. Sus palabras fueron un bálsamo de determinación en medio de la incertidumbre.
El compromiso de los empresarios mexicanos no flaquea. Continuarán reuniéndose con la Presidenta hasta el domingo, día en que se anunciarán las medidas de respuesta en el icónico Zócalo capitalino. “Estamos trabajando intensamente”, aseguró Cervantes. “La Presidenta está tomando muy en cuenta al sector privado, y el domingo hará un anuncio crucial”.
Por su parte, Altagracia Gómez, coordinadora del Consejo Asesor Empresarial de Presidencia, reveló que también se acordó acelerar la implementación del Plan México. “Todos estamos listos y unidos”, declaró con convicción. “Trabajaremos juntos para fortalecer el mercado nacional y estar atentos a los eventos que se avecinan, desde la próxima llamada con Trump hasta el anuncio del domingo”.
Cervantes, con la visión de un estratega, señaló que el Plan México podría convertirse en un instrumento bilateral. “El Plan México es parte de la agenda bilateral”, afirmó. “Ayudará a las empresas mexicanas a aumentar el contenido nacional. Las medidas de Trump han violado el T-MEC, pero el diálogo intensificado permitirá avanzar en su revisión”.
Entre tanto, una luz de esperanza brilló: Estados Unidos exentó por
## Project: Build a Traffic Sign Recognition Program
[](http://www.udacity.com/drive/traffic_sign_classifier)
### Overview
In this project, I use deep neural networks and convolutional neural networks to classify traffic signs. I train and validate a model so it can classify traffic sign images using the [German Traffic Sign Dataset](http://benchmark.ini.rub.de/?section=gtsrb&subsection=dataset). After the model is trained, I try out the model on images of German traffic signs that I find on the web.
The goals / steps of this project are the following:
* Load the data set (see below for links to the project data set)
* Explore, summarize and visualize the data set
* Design, train and test a model architecture
* Use the model to make predictions on new images
* Analyze the softmax probabilities of the new images
* Summarize the results with a written report
[//]: # (Image References)
[visualize_dataset]: ./output_images/visualize_dataset.png “Visualization”
[class_distribution]: ./output_images/class_distribution.png “Class Distribution”
[preprocess]: ./output_images/preprocess.png “Preprocess”
### Data Set Summary & Exploration
#### 1. Basic summary of the data set.
I used the pandas library to calculate summary statistics of the traffic
signs data set:
* The size of training set is 34799
* The size of the validation set is 4410
* The size of test set is 12630
* The shape of a traffic sign image is (32, 32, 3)
* The number of unique classes/labels in the data set is 43
#### 2. Exploratory visualization of the dataset.
Here is an exploratory visualization of the data set. It is a bar chart showing how the data is distributed among different classes.
![alt text][class_distribution]
Here are 43 random images from dataset with labels.
![alt text][visualize_dataset]
### Design and Test a Model Architecture
#### 1. Preprocessing
As a first step, I decided to convert the images to grayscale because it can reduce the complexity and performance of the model. As a last step, I normalized the image data because it improves the convergence of gradient descent.
Here is an example of a traffic sign image before and after grayscaling and normalizing.
![alt text][preprocess]
#### 2. Model Architecture
I choose LeNet architecture as my first model. I made some modifications to this model. As my first modification, I added one more convolution layer to the model. Then, I added one more fully connected layer to the model. And finally, I added dropout into the network. My final model consisted of the following layers:
| Layer | Description |
|:———————:|:———————————————:|
| Input | 32x32x1 grayscale image |
| Convolution 3×3 | 1×1 stride, valid padding, outputs 28x28x6 |
| RELU | |
| Max pooling | 2×2 stride, outputs 14x14x6 |
| Convolution 3×3 | 1×1 stride, valid padding, outputs 10x10x16 |
| RELU | |
| Max pooling | 2×2 stride, outputs 5x5x16 |
| Convolution 3×3 | 1×1 stride, valid padding, outputs 1x1x400 |
| RELU | |
| Flatten | outputs 400 |
| Dropout | keep_prob = 0.5 |
| Fully connected | outputs 120 |
| RELU | |
| Dropout | keep_prob = 0.5 |
| Fully connected | outputs 84 |
| RELU | |
| Dropout | keep_prob = 0.5 |
| Fully connected | outputs 43 |
| | |
#### 3. Training
To train the model, I used the AdamOptimizer. The batch size is 128, the learning rate is 0.001, the number of epochs is 200 and the keep probability of dropout is 0.5.
#### 4. Approach
My final model results were:
* training set accuracy of 0.999
* validation set accuracy of 0.989
* test set accuracy of 0.963
An iterative approach was chosen:
* I choose LeNet architecture as my first model because it is a well-known architecture and it is simple to implement.
* The first model that I tried was the original LeNet. However, its performance on validation data was not good.
* I tried adding one more convolution layer and one more fully connected layer. This improved the performance of the model.
* Then, I added dropout into the network. This improved the performance of the model and prevented overfitting.
* Finally, I trained the model with 200 epochs and achieved 0.963 accuracy on the test data set.
### Test a Model on New Images
#### 1. Five German traffic signs found on the web
Here are five German traffic signs that I found on the web:
<img src="./test_images/00000